All help topics
Help topics
- Getting Started
- Sales & POS
- Products & Inventory
- Purchases & Suppliers
- Customers
- Staff & Permissions
- Reports
- Branches
- Hardware
- Payments
- Settings
- Troubleshooting
- Billing & Subscription
- Workshop
- Training
- Sales Agents
- Laundry
- Accounting
- HR & Payroll
- Hotel
- Services
- Communication Center
- Online Store
- CRM
- Restaurant
- F&B Manager
- Production
- Projects
- Asset Management
- All topics
On this page
How to Read Production Reports
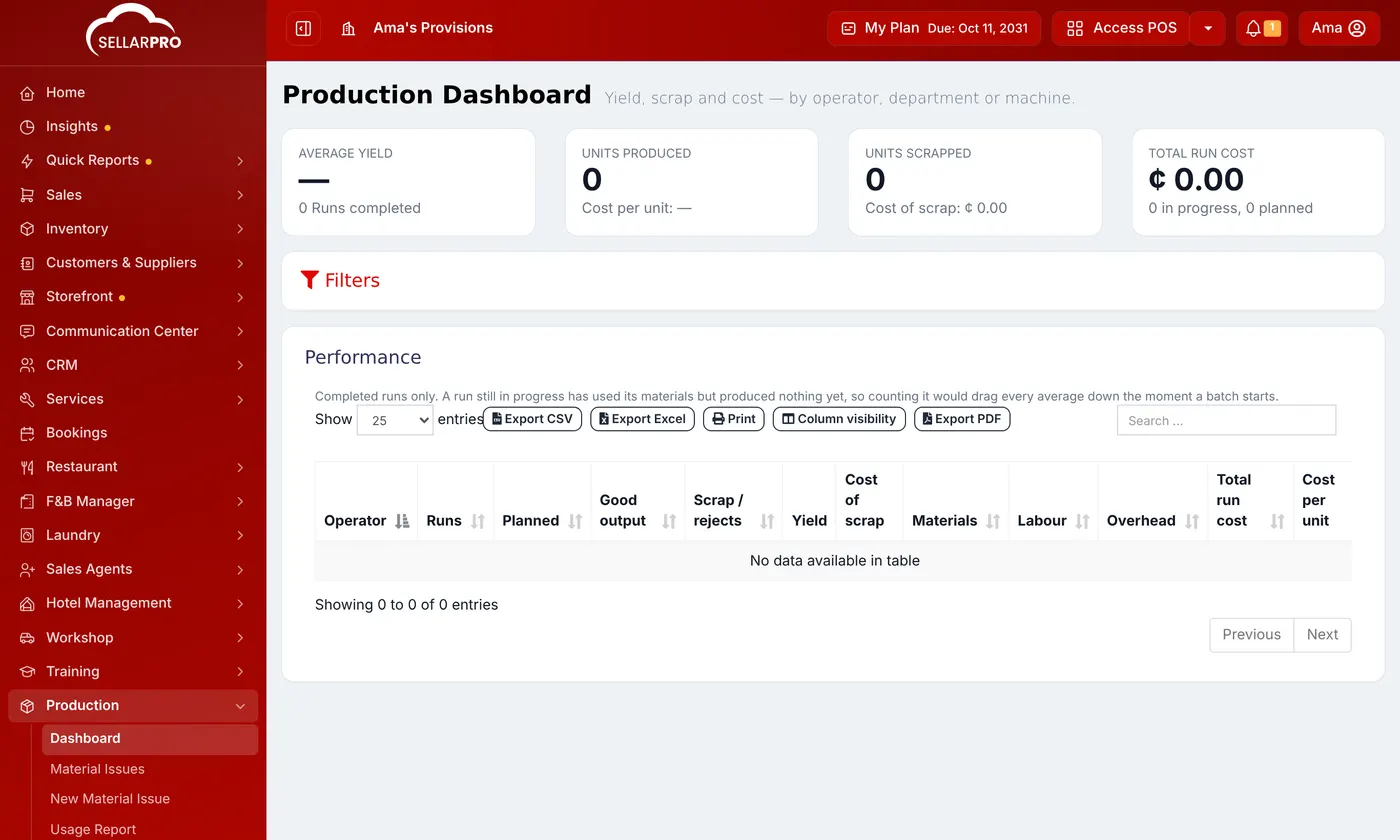
Production → Dashboard shows average yield, units produced and the cost per unit, units scrapped and their cost, and total run cost, with performance by operator, department or machine. The Usage Report and Materials Report show what each department and run consumed.
The dashboard
Open Production → Dashboard. The figures across the top:
- Average Yield: good output against what was planned, over completed runs.
- Units Produced and the cost per unit.
- Units Scrapped and the cost of scrap.
- Total Run Cost, with how many runs are in progress or planned.
Below, Performance breaks it down by operator, department or machine: runs, planned and good output, scrap, yield, and the cost of materials, labour and overhead. Only completed runs count, so a batch that has started does not drag the averages down.
What was used
- Production → Usage Report: materials issued, by department and period.
- Production → Materials Report: what each material was used for and what it cost.
A machine whose yield keeps falling is losing material. The machine view shows it before the stock count does.
Was this article helpful?
Thanks — your answer helps us improve this article.
Still need help?
Can’t find the answer you’re looking for? Our support team in Accra can help.