
All help topics
Help topics
- Getting Started
- Sales & POS
- Products & Inventory
- Purchases & Suppliers
- Customers
- Staff & Permissions
- Reports
- Branches
- Hardware
- Payments
- Settings
- Troubleshooting
- Billing & Subscription
- Workshop
- Training
- Sales Agents
- Laundry
- Accounting
- HR & Payroll
- Hotel
- Services
- Communication Center
- Online Store
- CRM
- Restaurant
- F&B Manager
- Production
- Projects
- Asset Management
- All topics
On this page
How to Read Insights
Short answer
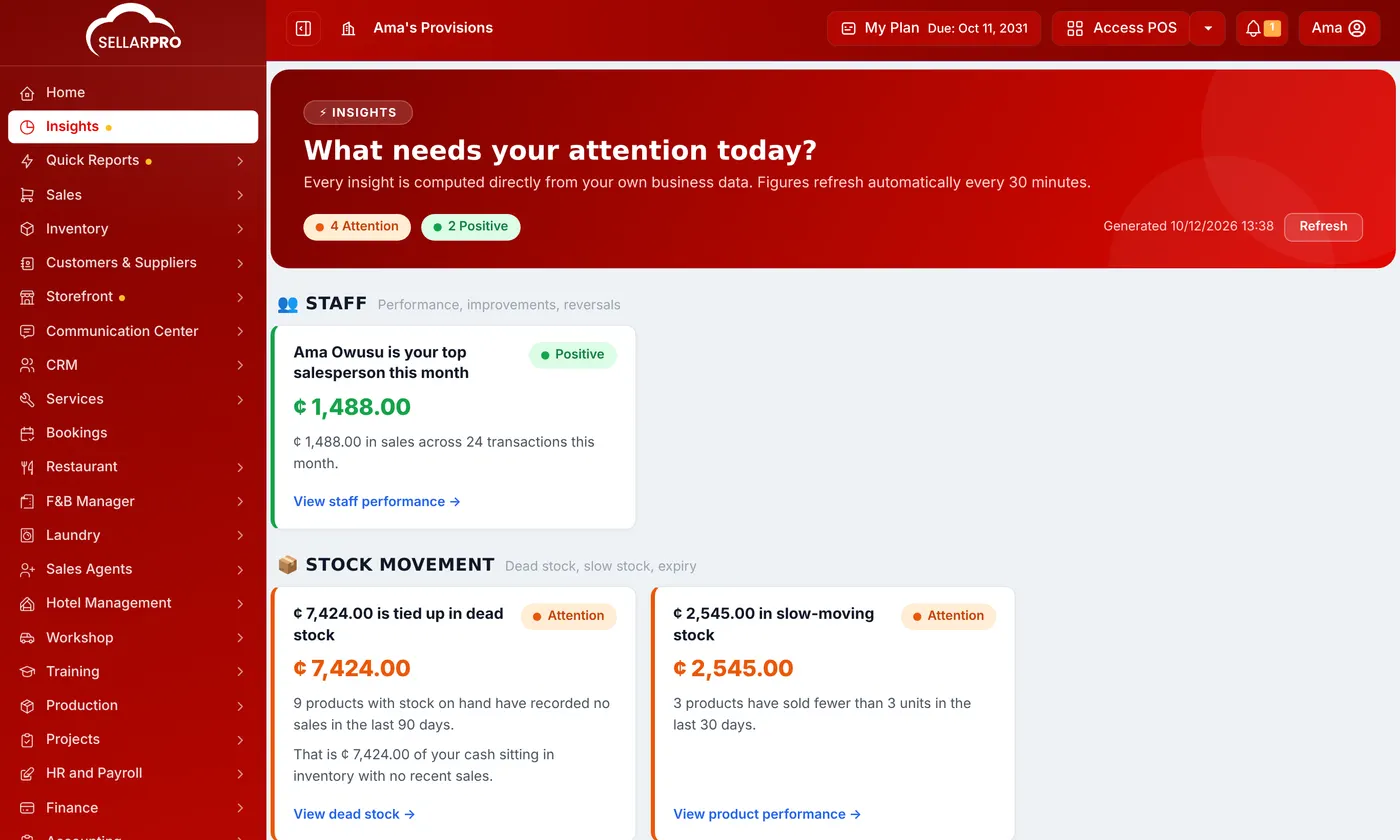
Open Insights from the menu. It reads your own data and lists what needs your attention, such as dead stock, customers who owe you, slow sellers and unusual activity, beside what is going well, in sections for staff, stock, sales, debts, anomalies and operations. Each insight links to the page with the detail.
Insights answers one question: what needs my attention today? Every insight is worked out from your own sales, stock and payments, and the figures refresh every 30 minutes.
Steps
- Open Insights from the menu.
- Read the count at the top: how many insights need Attention and how many are Positive.
- Go through the sections. Each insight says what is happening, how much it is worth and why it matters.
- Click the link under an insight, such as View dead stock, to see the detail behind it.
The sections
- Staff: who sells most, improvements and reversals.
- Stock movement: dead stock, slow stock and expiry.
- Sales: trends, top products and busy periods.
- Debts: who owes you, how old the debt is and how concentrated.
- Anomalies: unusual behaviour and unexpected changes, such as a run of deleted sales.
- Operations: CRM, invoices, projects and services.
A section with nothing to report says so. Click Refresh to recalculate now.
Common questions
Who can see Insights?
Owners and admins, and roles given View Insights under Access Controls → Roles.
Was this article helpful?
Thanks — your answer helps us improve this article.
Still need help?
Can’t find the answer you’re looking for? Our support team in Accra can help.