How is your business doing right now? Not last month—right now. Can you answer without opening multiple spreadsheets, calling your shop, or waiting for end-of-day reports?
A business performance dashboard gives you this power. One screen. All your critical numbers. Updated in real-time. SellarPro includes a comprehensive dashboard that shows today's sales, profit margins, inventory alerts, and trends—so you can make decisions based on data, not guesswork.
📊 What Is a Business Performance Dashboard?
A business dashboard is a visual display that shows your key metrics in one place. Instead of checking multiple reports or spreadsheets, you see today's sales, inventory levels, profit margins, top products, and trends at a glance. SellarPro's dashboard updates automatically as transactions happen—giving you real-time visibility into your business.
📋 Table of Contents
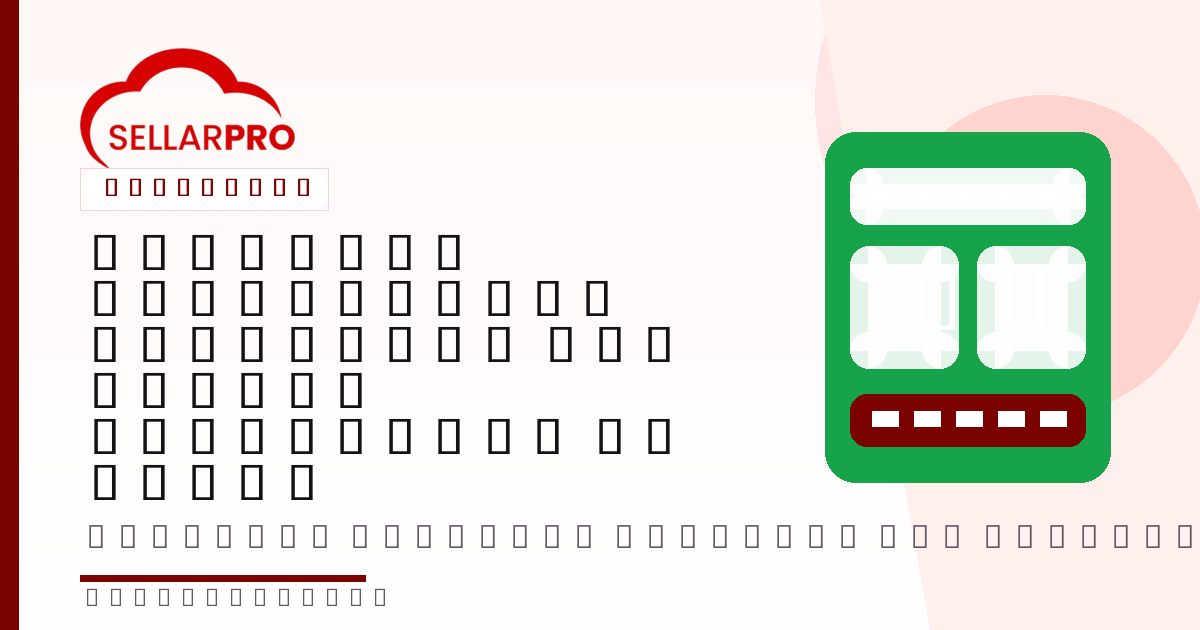
📊 Sample SellarPro Dashboard View

Why Every Ghana Business Needs a Dashboard
In the fast-paced Ghana retail environment, waiting for end-of-month reports means reacting to problems weeks after they start. A dashboard changes that—giving you instant visibility into what's happening now.
Dashboard Benefits for Business Owners
- Spot problems early: Sales down today? See it immediately, not in 30 days.
- Make faster decisions: Data at your fingertips means quick, informed choices.
- Monitor remotely: Check your business from anywhere—home, traveling, anywhere.
- Track staff performance: See who's selling and who needs support.
- Never run out of stock: Low inventory alerts before you lose sales.
- Understand trends: See patterns in your sales over time.
💡 Business Insight: Business owners who check their dashboard daily are 40% more likely to identify and address problems within 48 hours compared to those relying on weekly or monthly reports.
Key Metrics Every Retail Dashboard Should Show
Not all numbers are equally important. Here are the metrics that matter most for Ghana retail and wholesale businesses:
Sales Metrics
- Today's Sales Total: The headline number—how much have you sold today?
- Transaction Count: Number of customers served—indicates foot traffic.
- Average Transaction Value: How much does each customer spend on average?
- Sales vs. Target: Are you on track to meet your daily/monthly goals?
- Comparison to Last Week/Month: Are you growing or declining?
Profit Metrics
- Gross Profit: Actual money made after product costs.
- Profit Margin %: Percentage of sales that's profit.
- Best Margin Products: What's making you the most money per sale?
Inventory Metrics
- Low Stock Alerts: Products that need reordering soon.
- Out of Stock Count: Items you've run out of (lost sales!).
- Top Selling Products: What's moving fastest?
- Slow Moving Stock: What's tying up capital?
SellarPro Dashboard Features
SellarPro software includes a comprehensive dashboard designed specifically for Ghana retail businesses. Here's what you get:
📊 Sales Overview Widget
- Today's total sales with comparison to yesterday
- Number of transactions
- Average basket size
- Sales by payment method (Cash, MoMo, Card)
- Hourly sales breakdown (see your peak times)
💰 Profit Tracking Widget
- Today's gross profit
- Overall profit margin percentage
- Top profit-generating products
- Margin trend over time
📦 Inventory Alerts Widget
- Products below reorder point
- Out-of-stock items
- Products expiring soon (for pharmacies, food retail)
- Slow-moving stock warnings
👥 Staff Performance Widget
- Sales by staff member today
- Top performer leaderboard
- Transaction counts per staff
- Discounts given by staff
📈 Trends Widget
- Sales trend (7-day, 30-day, 90-day)
- Best/worst days of the week
- Seasonal patterns
- Year-over-year comparison
Essential Retail KPIs Explained
Understanding what each metric means helps you use your dashboard effectively:
| KPI | What It Measures | Why It Matters |
|---|---|---|
| Gross Sales | Total revenue before any deductions | Shows your overall business activity level |
| Net Sales | Gross sales minus returns and discounts | Actual revenue you keep |
| Gross Profit | Sales minus cost of goods sold | Money available to cover expenses and profit |
| Gross Margin % | Gross profit as percentage of sales | Efficiency of your pricing strategy |
| Avg. Transaction Value | Total sales ÷ Number of transactions | Average customer spend—indicates upselling success |
| Sell-Through Rate | Units sold ÷ Units received | How quickly inventory moves |
| Stock Turnover | Cost of goods sold ÷ Average inventory | How many times you sell your inventory per year |
Mobile Dashboard Access
Your business doesn't stop when you leave the shop. SellarPro's dashboard works on any device—smartphone, tablet, or computer—so you stay connected anywhere.
What You Can Do on Mobile
- Check real-time sales: See today's numbers while commuting, at lunch, or at home.
- View alerts: Get notified about low stock, unusual activity, or sales milestones.
- Monitor staff: See who's working and how they're performing.
- Compare branches: If you have multiple locations, compare them on the go.
- Make decisions: Approve purchase orders, adjust prices, or message staff.
💡 Pro Tip: Set up daily summary notifications to your phone. Every evening at closing time, receive an automatic message with your day's key stats—even if you didn't visit the shop.
Multi-Branch Dashboard
If you operate multiple locations, SellarPro provides a consolidated view across all branches—eliminating the need to call each shop or visit in person.
Multi-Branch Dashboard Features
- Consolidated totals: See combined sales, profit, and inventory across all locations.
- Branch comparison: Side-by-side performance of each location.
- Top/bottom performers: Quickly identify your best and worst branches.
- Drill-down capability: Click any branch to see detailed metrics.
- Stock levels by location: Know inventory at each branch without calling.
Learn more about multi-branch management with SellarPro.
Dashboard Software Pricing in Ghana
| Solution | Real-Time Dashboard | Mobile Access | Alerts | Price (GHS/month) |
|---|---|---|---|---|
| SellarPro Solo | ✓ | ✓ | ✓ | 99 |
| SellarPro Growth | ✓ | ✓ | ✓ | 150 |
| SellarPro Business | ✓ | ✓ | ✓ | 250 |
| Basic POS Systems | Limited | ✗ | ✗ | 80-100 |
| Standalone BI Tools | ✓ | ✓ | ✓ | 500-1000 |
View complete SellarPro pricing and features.
See Your Business Clearly
Get a dashboard that shows you everything important—sales, profits, inventory, and trends—all in one place, updated in real-time.
Start Your Subscription →